
A life partner can make or break a person’s life. An understanding spouse can make your life happy & successful.
And if the spouse is not accommodating & caring, the marriage may not work!
Same thing can happen to you as an investor when you buy a stock. It can make your portfolio shine or you may lose all the money.
I personally read & follow few investors in India. And one of them is Mr. Basant Maheshwari. In his book ‘The Thoughtful Investor’, Basant put this analogy very well.
He mentioned, we should understand the difference between Dating & Marriage.
You can go to blind date with a girl or boy. You can enjoy the moment.
If the boy is charming & handsome that is great. If the girl looks fantastic & talks well that is cool.
But end of the day it is just a date.
Dating with a girl or boy does not mean that person is a marriage material for you in long term.
Marriage requires trust, integrity, respect and may be some expectations from each other.
Basant mentioned that taking short term position or doing Intra-day trading is often like a blind date.
You can get lot of thrills but there is no long-lasting difference in your life. But long-term wealth creation in equity market is more of a marriage.
There will be ups & downs but if you have conviction and proper analysis in place you can be happy & successful in your journey.
So, to quickly summarize,
Dating = Short term trading.
Marriage = Long term wealth creation.
When I first read this analogy, I was amused.
But as I am growing older, spending time with my family and getting experienced in equity investing, I can understand the connection.
In next few sections, I will be focusing on few aspects of fundamental analysis which help you to minimize the possibility of losses in long term equity investing.
I will share what ingredients you must look for as a newbie investor when looking at a stock for long-term investing to minimize the chance of losses.
You may know some of the concepts well, but I hope you will still enjoy knowing them through this write up.
You’ll be punished if you compromise with this..
After investing more than a decade in equity market, I feel there is one thing which you cannot compromise when selecting a stock.
If you compromise and do not pay attention on this factor, then there is a higher probability that you will be severely punished in future.
Please remember this line forever – Do not compromise with ‘Management Quality‘ when evaluating a business for investment.
If you do through research on management quality, the probability of going wrong is lesser.
If there is any doubt on the management, you should not discount it. You should avoid the company at any cost.
In this section, I will share 4 factors to evaluate management objectively. I found that these 4 factors indirectly forecast management intention & quality.
Let’s dive in.
To evaluate the management of a company you cannot visit a company and cannot meet the board of directors.
If you are really a big investor, that might be possible.
But being a small retail investor visiting a company premise, factory, workshop or talking with the CEO in person is not possible.
So, check the 4 data points to evaluate the management.
#1 ROE (Return On Equity)
#2 Dividend Rate & Frequency
#3 Tax Rate
#4 Change in share-holding pattern
~ ROE ~
ROE gives you the ability of the management to deploy shareholder’s money. If the management is inefficient, then ROE will be low.
There are businesses where ROE cannot be higher due to nature of the businesses. You may consider not to invest in them.
If the management is inflating their balance sheet to hide wrongdoing or showing extra profit, then eventually the ROE will become poor.
So, ROE is such a ratio which captures efficiency and possibilities of wrongdoing with the company account.
There is no thumb rule on how much ROE you should look for but anything around 15% is good. The more it is, the better the management on their efficiency.
~ Dividend Distribution ~
In the stock market very few things are real.
If there is anything real in your hand, that is dividend.
When you invest in a stock, you wish the price to go higher and then you sell & make capital gain.
But does the business pay you anything?
Stock price appreciates to pay for growth of the business.
But as a minority share owner of the company, if you do not sell the stock what is your earning? Nothing at all. Isn’t it?
Whatever the actual profit business earns, if a portion of that earning is shared with minority shareholders, that is called dividend.
Dividend distribution means two important things –
#1 The profits are real and not eye wash.
#2 The management does care for you & me (retail investors).
So, when a company pays regular dividend from their profit, it signals two important things – the profits are real, because the company cannot pay you real cash from false profit. There must be real profits.
And the company promoters care about small investors and want to share the profit with all.
~ Tax Rate ~
Tax rate is often neglected by common investors. But it also signals trustworthiness of the management.
If a company is continuously showing higher profit but tax outgo is low, that means the profit is inflated.
Because like dividend, tax payment is in real cash. You cannot pay tax without real cash.
So, a company which pays higher taxes with higher profit makes more sense to be considered as trustworthy.
Please remember few companies do get special tax rebate for manufacturing or doing some special business.
So, lower tax rate should not always raise the eyebrows. If you found lower tax rate in the P&L statement of a company, you should evaluate further.
~ Change in share holding pattern ~
Shareholding patterns often reveal hidden intention of the business owner.
For example, if you find that there is continuous share sell of the promoter group captured in quarterly shareholding pattern then you should investigate further to know what warrants this sell.
Often it happens that the promoter wants to scale the business and they need investor for cash infusion.
But if there is continuous sale of shares from the promoter group that can signal something alarming.
It might mean that the promoter group may know some business headwinds or something difficult coming in future. And there is a probability that the share price could go lower.
Hence, they are selling off their position in the market. Please make sure you do further due diligence.
| #1 Low dividend or no dividend does not always mean that the company is bad. Smaller & fast-growing companies do not want to pay dividend because they want cash to expand their business and that is normal. Stock analysis does not go in a straight line, and you need to consider factors before arriving to a conclusion. #2 For finance institutions just looking at ROE may not be the right metrics. Rather you should consider ROA (Return on asset). Higher ROE of a finance company (Bank, Small Finance Bank, Lending business) may be due to higher leverage and that can be risky in many situations. |
Why integrity is everything?
I think after reading the last section you have idea on ROE, Dividend rate, Tax rate and Share holding pattern.
But in this section, I am going to talk about a characteristic of human behavior which is most important to consider in almost every sphere of life.
I am talking about ‘Integrity’.
And when evaluating a company management, please look at the integrity of top management.
If the promoter of a company does not have any integrity, please avoid that company.
Because if you buy a company with bad management, then sooner or later your portfolio will go for a toss!
————————————
In 2nd quarter of 2015, I was evaluating a company for investment worthiness.
My screening told me that the company was doing great.
Sales volume increment year on year was in tune of 15-20%. Profit was growing at rate 25%+.
ROE was decent and the company has low debt.
More importantly the company is expanding fast, addressing the financial & non-financial service space of urban & rural area.
They have strong franchise base & very good technological platform to address the customer base.
The company was ‘Vakrangee Ltd’.
Vakrangee was in news because they are opening Physical stores in rural India across multiple states.
These stores act as point of service for banks, financial institutions, and other multinational companies to provide service till the last mile.
For example, Bank of Baroda was a Vakrangee partner to cater to its rural customers.
LIC was taking help of Vakrangee to collect insurance premium.
Amazon was considering whether they should use company like Vakrangee to provide service to the most interior part of India.
In fact, Vakrangee was coming up as a company of new decade where there is huge head room to grow with rural story to play out.
————————————
I was seriously thinking about buying shares of Vakrangee Ltd.
I bought a small position in Vakrangee & continued to do my research on the company.
From internet I came to know that Vakrangee was in news few years back for some management issues.
There were insider trading allegations. This was enough to trigger the alarm. But I discounted this information.
The excellent future prospect was important for me to buy the story and I increased my position.
I was holding Vakrangee with an average price of INR 128 apiece.
In next few quarters Vakrangee kept on posting decent quarterly results and more importantly the future prospect was very well received in stock market.
FIIs & some big funds are started paying notice to this company.
As a result, the stock price was going steadily up.
In January 2017, I spotted a different stock opportunity and sold my position in Vakrangee Ltd to invest elsewhere.
Within 16 months of my holding, Vakrangee touched 300+ and I sold my position at INR 306 apiece.
I was very happy as I made 92%+ CAGR with Vakrangee. A journey of 128 to 306 in a span of 16 months.
I was happy but I was wrong.
After 1 year of my exit, in January 2018 there was free fall of the stock price.
There was continuous lower circuit of Vakrangee and that shook the investors of the company.
PWC (Price Water House Coopers), Vakrangee Ltd’s auditor alleged that not enough information is shared with them to make a fair auditing of the book of accounts.
This was enough for the market to sense wrongdoing by the company management and market punished the stock price like anything.
Always keep in mind, Integrity is the most valuable asset be it in your personal life or stock market!
Do you want to be a detective?
I think all of us in some part of our life, loved to read detective stories or thrillers.
Do you know sometimes CAs (chartered accountants) act as detectives to investigate truth behind a criminal incident?
For example, the Satyam Scam which shocked the Indian equity market, was investigated by CAs who are expert in forensic auditing.
They helped the detective agencies, economic offence wings & SEBI to conduct investigations to find out the trails of funds which Satyam promoters siphoned off from the company.
As a direct equity investor, it is essential to act as a detective sometimes.
If you find any company too good to invest, please think twice.
It is important to understand whether the company promoters are real and with right intentions.
————————————–
In 1st quarter of 2017, I was evaluating a company.
My criteria were finding out high growth companies with lot of industry tailwinds and companies which has probability of growing fast in next decade.
I ran screeners and a company fancied me. The name was ‘8K Miles Software’.
This company is a software service company providing very specialized service in cloud platform.
For an example in western countries healthcare information is very sensitive information.
Doctors & medical institutions need to follow lot of guidelines on how they should store patient information in any format.
8K Miles created software cloud platform which helps enterprises, healthcare service providers & hospitals to store patient’s data in a very secured way in public cloud.
This is a sunshine area in software industry.
There is lot of tailwinds in the industry and almost all the companies are talking about cloud & digital.
So, I was interested and started doing further research on the company.
I found that the revenue or sales of this company is growing 40% year on year (YOY). The profit is growing in the tune of 100%+ YOY.
I was very much interested in doing further research on the company because growing profitable revenue in tune of 40% yoy is not a matter of joke.
Out of 6000 – 7000 listed business in India very handful companies can grow business 30%+ yoy.
I kept on doing my fundamental research and also started taking position in this company.
As I continue started investing, stock price also started going north and giving me the confidence that my analysis was right.
But during my analysis, I found some information which creates doubt about the management.
Here are the red flags –
#1 Earlier promoter of the company had a history of insider trading.
#2 Current promoters (CEO and CFO) are also interested in different businesses other than software.
#3 The standalone revenue & profit is negligible than consolidated accounts. And consolidated accounts are primarily of overseas subsidiary of the Indian company. And there was question mark (?) on accounting standards of the foreign subsidiaries.
#4 There was significant difference between Cashflow statement & P&L statement of the company.
#5 The company balance sheet has high value intangible assets as IP (Intellectual properties) which is not very common for many IT companies.
I must say I did not know all the above points at a time.
In equity market you should not expect, you will know everything and then invest. It does not work in that way.
In my case as I increased my position continuously, I also came to know about these dubious facts.
I made a grave mistake by discounting all these red flags and continue to hold my investments.
Needless to say, the dream run of 8K miles halted and there was a painful downward journey of the stock price.
Because of the lack of the integrity of the management, siphoning of profits from company accounts to the promoter’s privately funded business and false reporting of revenue and profit, the promoter lost their credibility in the market.
The company auditor ‘Deloitte’ raised red flags on the accounting practices, suppression of material facts and eventually resigned.
The stock price followed these series of events and went into a downward spiral to make the investors of the company shocked & pained.
I suffered 90% loss in 8K Miles Ltd and learnt good lessons.
————————————–
Though during my fundamental analysis, I did lot of investigation, I did not follow the process.
I gathered much information, but I discounted the negative information and became fully confident on the high growth trajectory of the business.
Please remember it is not only important to do effective analysis, but you should also have a strong process in place to discard businesses which deviates from that yardstick.
Be a detective when analyzing a high growth company and never easily believe a story until & unless you are fully satisfied.
Learning from mistakes in stock market is painful but the learning makes you emotionally equipped to do better next time in the market.
| I wear a detective hat many times when I do analysis for a high growth company to understand whether the high growth is actual or eye wash. For example, in case of 8K miles I contacted couple of employees of 8K miles through LinkedIn and talked casually to understand whether the business is commendable. You can see one such snippet below – 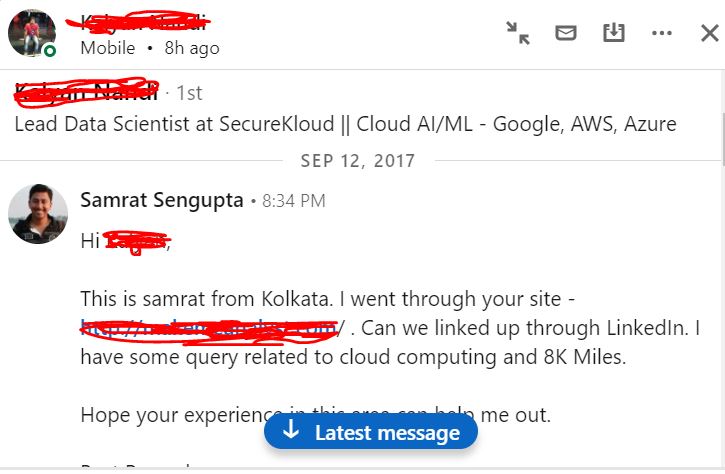 |
I hope you understand, direct equity investment is not always very simple. If you are putting big sum into table and invest in relatively small sized companies you need to ramp up your skills, analysis power and a mindset of detective.
Try to avoid these type of promoters..
Please keep in the mind, bad management quality is the wealth destroyer in long run.
Before jumping into the next topic, I would like to quickly mention the type of company management which you should generally avoid.
#1 Go to google and search with
“Company Name” + Fraud
“Company Name” + Insider trading
“Company Name” + SEBI Notice
And some other negative keywords and find out whether there is negative news in public domain.
#2 Less known promoter with interest on several types of business.
Example – Software business promoter having stake in agro-products company.
Cement company promoter also starting a media business.
Whenever you see a small-cap or midcap business promoter is venturing into unrelated sectors, please be little more cautious.
#3 3rd or 4th generation promoters in family managed business. Particularly if there is no professional manager / CEO managing the operational activities.
#4 Also avoid companies which is ran by a promoter who is nothing to do with business! Example – Govt of India. Try to avoid any business which is ran by GOI (Govt of India).
Generally, Government in our country is of socialist nature. If there is any calamity and socio-economic problems, Government is trying to solve it primarily looking at vote bank politics.
If there is drought, government orders PSU banks to go slow on recovering loans!!
Please understand Government in our country is trying to run an NGO and a business hand in hand. And as a result, most of the govt enterprises are sick or going to be sick in future.
So, avoid government owned companies as a rule.
Please consider these cases and do more due diligence before you venture into such companies.
Valuation – The holy grail!
In this section, I want to discuss an important factor in fundamental analysis.
This important & interesting topic is to gauge the valuation of a company or business.
I feel that this topic is very difficult to articulate because there is no full proof method to understand valuation of a company.
For an example, do you think a Maruti Alto is cheaper than a Mercedes C class? It is cheaper.
But please remember the cheap price tag comes with lot of tradeoffs. You cannot compare an Alto with a Mercedes.
Mercedes C class can be much higher priced but at the same time it has facilities & qualities which a Maruti car may not give you in any condition.
In market, value of something depends on what it offers you.
A good strategy could be to understand whether the business is extremely overvalued, and it is better to avoid or it is in very discounted price, and you should grab it.
Valuation as a process can give you some understanding on what the possibility of loss from the investment is.
Please do not think there is a magic rule of valuation which can give you a sure shot idea on underpriced or overpriced securities.
It is not like that.
So, let’s spend some time to understand some basic jargons used in valuation and where to use them.
Let’s learn the valuation jargons!
In equity market the price & value of a company does not go hand in hand.
Often there is difference between the price of a share and actual underlying value of that share.
This difference is often an important factor to gauge the value of a company.
Now there are several ways to value a business.
One way is measuring how much profit the business is generating compared to its price.
There are many such ways and different investors consider different metrics for different reasons.
Let’s discuss about – PE, PB, Div yield, PEG in this thread.
——————————
PE – Price to Earnings ratio = Current market price of the share / Earning per share.
**Earning per share (EPS) = Net profit of the company / Outstanding number of shares.
If you divide price of an equity share with earning per share, then you get PE. PE ratio gives an straightforward idea of how much money investors are willing to pay to get 1 Rs profit back from the company.
Now, with this valuation metric if you feel a company’s share with lower PE is cheap compared to a company with higher PE ratio, then this understanding may not be correct.
Because in life & share market nothing comes free!
In market, often investors look into future to decide the price.
A company which has high possibility of profit continuity always commands higher PE than rest of the market. Let me explain it.
For an example, if tomorrow there is another pandemic or say there is recession or a world war, what is the possibility that we will continue to brush our teeth?
We will brush our teeth as usual, come what may! There is no question about it. Right?
So, Colgate-Palmolive as a company may not see a huge sales & profit erosion in future if another pandemic or a war happens. Their products are simple to understand and almost everyone need their products every day.
A company which has high brand recall, everyday used products, strong penetration, and high visibility of repeat usage in any economic condition generally have very high PE compared to rest of the market.
There is no confusion on why Colgate-Palmolive or Hindustan Unilever commands high PE from the investors.
——————————
PB / PBV – Price to book value = Current market price of the share / Book value per share.
Book Value per share (BV) = The asset of the company which can be liquidated and distributed to the shareholders of the company hypothetically if there is a bankruptcy or the company is closed.
So, essentially it means – any company has assets, and the assets have some value. If we divide the current market price of the share with the value of assets per share, we come to a ratio.
This ratio is called PB (Price to book value).
In case of PB we are not valuing a company based on its earning rather we are valuing it, based on its assets.
——————————
Dividend Yield = Dividend received per share / Current market price of the share.
Dividend yield is a very simple ratio to gauge. But the beauty of dividend yield is something else.
Dividend yield is a way to value a company on basis of what you receive practically in your hand.
Let me explain.
In case of PE ratio, you are valuing the company based on how much the company make per share compared to its share price. But do you receive the profit or earning in your bank account? You do not.
Profits made by company is not realized at your level directly.
But dividends received in your hand is actual, so when you value a company based on dividend received, the implication is lot different.
Let’s dive deep.
For example, ABC Ltd.’s current price is 100 rupees. ABC Ltd pays annual dividend of 8 rupees. So, it has a dividend yield of 8%.
Now if there is a market crash tomorrow, many shares price dip to low level.
Say, ABC Ltd also saw price correction of 20% and the current market price of ABC Ltd is 80.
With current market price of 80 rupees and yearly dividend history of 8 rupees, the dividend yield of ABC Ltd is now 10%.
Now seat back and think, how many investments opportunity can give you 10% return on your capital. Today banks are giving maximum 6% and other investments are yielding somewhere near to that.
Here you are getting a business which is paying you actual cash of 10% on investment.
As a result of this analysis, market participants rush to buy a high dividend paying stock whenever there is a price correction.
But because of this rush, eventually the price does not dip and the price of the share bounce back easily.
The dividend yield acts as a life jacket of the stock price and helps it to float a higher level. Isn’t it fascinating?
——————————
PEG – Price to earnings growth = Price to earnings ratio / Annual EPS Growth.
We already discussed about PE ratio in details in the beginning. If we divide the PE ratio with the annual eps growth rate of the company, we come to something called PEG.
Many times, a high growing company has commanding a higher PE. In such situation, one valuation metrics could be looking into the PE ratio itself in comparison to the profit growth that company is showcasing.
The trick here is to find the reason behind the high PE. It can happen that a high PE company compared to its peers is actually demanding the high PE because of its above normal rate of growth.
If we look at the PEG ratio, we may justify the high PE.
For a highly growing company the PEG ratio might reveal that the company is cheap compared to its current growth rate.
But please remember PEG is a very futuristic metric, when you value a company based on PEG ratio you are certain that you are valuing the company on future growth rate.
If the company does not show similar level of growth in future earnings, you can see the price of the share nosedive.
How to value a stock?
I always felt too much analysis is difficult for common investors and it is better to gauge the valuation in easy to understandable and simple way.
So, I will discuss a simple way to gauge the valuation of a company or stock.
In this process, I will use PE & PB primarily. PE & PB ratio is already discussed in last section.
Now to use a simple tool to value a business, we will check few metrics in valueresearchonline.
VRO (ValueResearchOnline) is predominantly known for understanding basics & advanced concepts of mutual funds. But I find it handy when looking at valuation related analysis for companies.
In this analysis we will do following.
#1 Value a business with its historical median.
#2 Trying to understand if a business is cheap, why it is cheap?
We will try to value a well-known software company and a retail bank as an exercise.
Let’s start with TCS (Tata Consultancy Services). They are the biggest software service business in India.
I am taking couple of snapshots from VRO and pasting below for TCS.
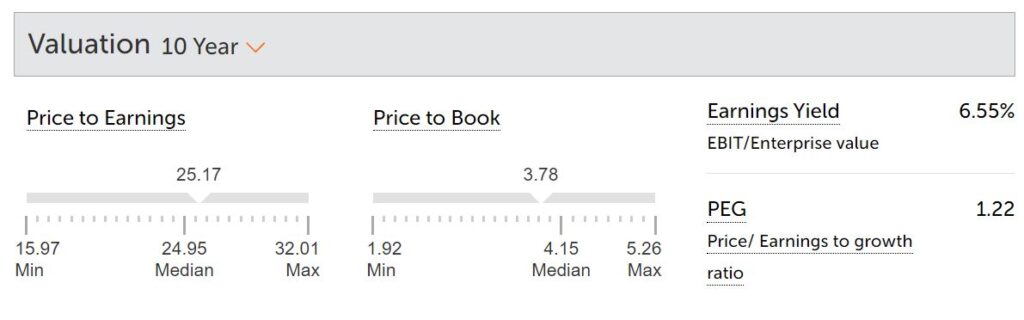
The next image is the current valuation matrix of TCS with respect to the median values. The median values are considered with a time scale of 10 years.
Pay close attention to the median PE of TCS and current PE of TCS.
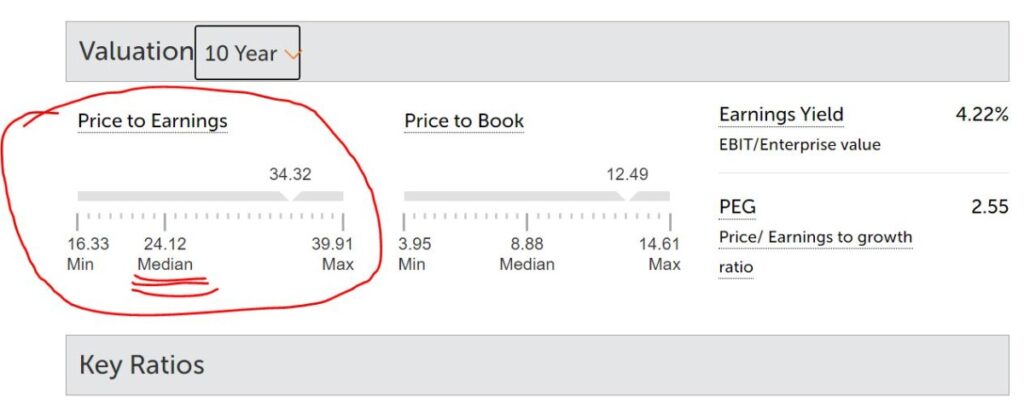
You can clearly see in the above image that price to earnings (PE) of TCS is hovering just above 34 right now. But the historical average PE of TCS is 24.12 in the 10 years’ time frame.
Now my focus is to find those price points of TCS, when the PE is below 24 in last 10 years’ time horizon and then how the stock price behaves afterwards.
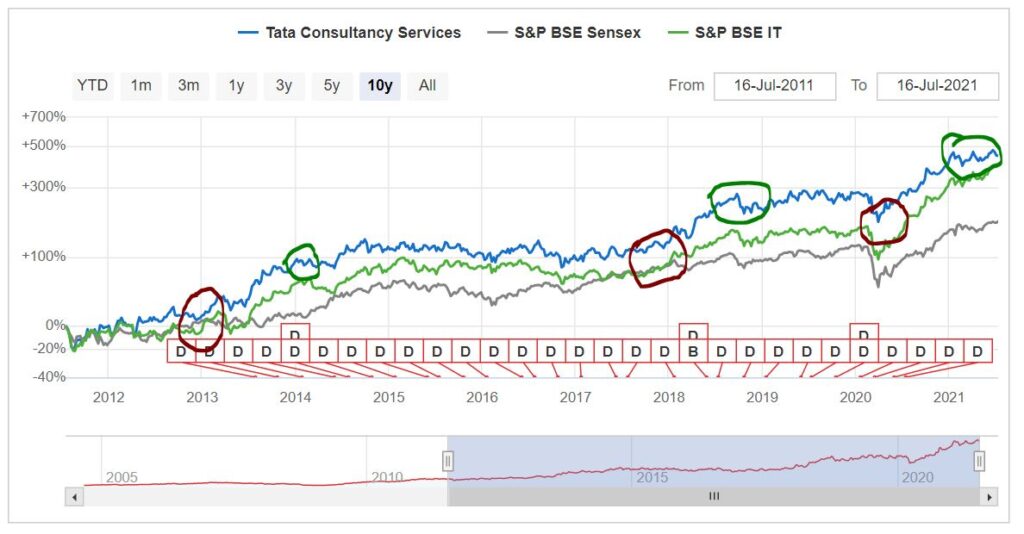
In the below snapshot I am putting 10 years PE of TCS in a simple graph. Just below that there is another graph of TCS share price in 10 years’ time frame.
Please pay close attention to both the images.
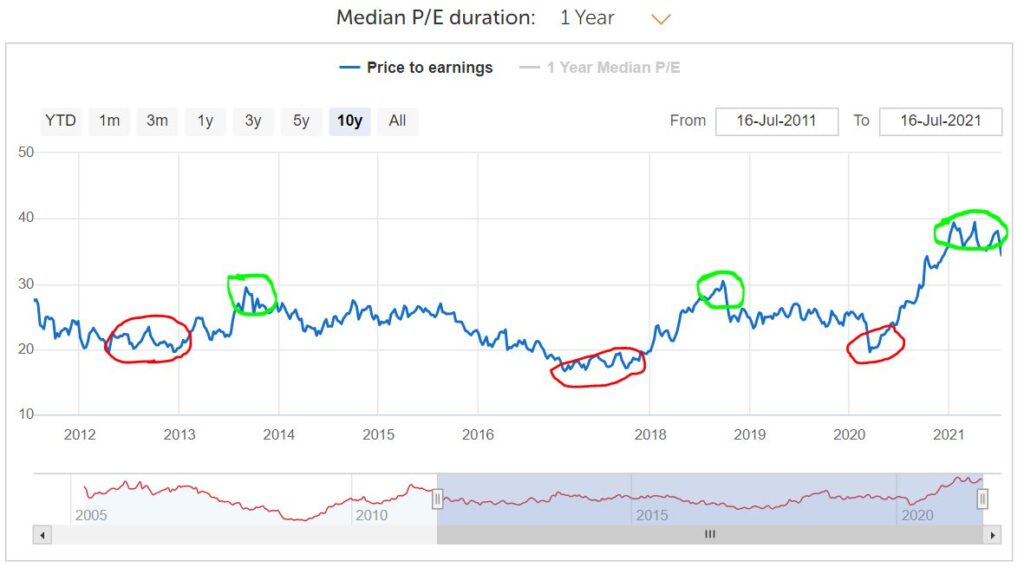
In the first graph which depicts the 10-year PE value, I encircled 3 regions in RED. These 3 regions are places where the stock price touched PE 20 for brief period.
And after that you can see 3 circle which are encircled as GREEN. Where the PE touches 30+. In most of the cases, the gap between these two events is only 1 year.
Now if you look at the second image on price, you can see the same regions marked in BROWN (sub 20 PE region) and price run up afterwards (PE 30+ regions) marked in DEEP GREEN.
Any investor who entered TCS stock when the stock price floored and PE was around 20, was handsomely rewarded within a span of 1 year with 50% increase in stock price.
If the broad business scenario is same, then TCS outperformed whenever it touches PE 20 or around that region.
Do not you think if you analyze like this, then possibility of loss will be lower.
Do not you think the margin of safety is higher in this model and reward is high.
Now, let us value a retail bank in the next section.
How should you value a banking stock?
Let us focus on valuing a financial company or bank.
To help this simple analysis, I need a ratio. The ratio I am going to use is PB (Price to Book value).
If you do not know about PB, then go back to earlier section on valuation jargons and you will learn about it.
So, fundamentally what we will do here is – trying to find an entry position in a bank with help of price to book value.
I am using the very basic information available from site – valueresearchonline (VRO).
Here is the 10-year median PB with respect to present PB of HDFC bank.
Now my target will be to mark the HDFC Bank’s 10-year PB graph chart whenever the current PB is significantly below the median PB of 4.15. Also, I will try to mark those places where current PB is significantly higher than median PB.
And below is the chart with my marking.
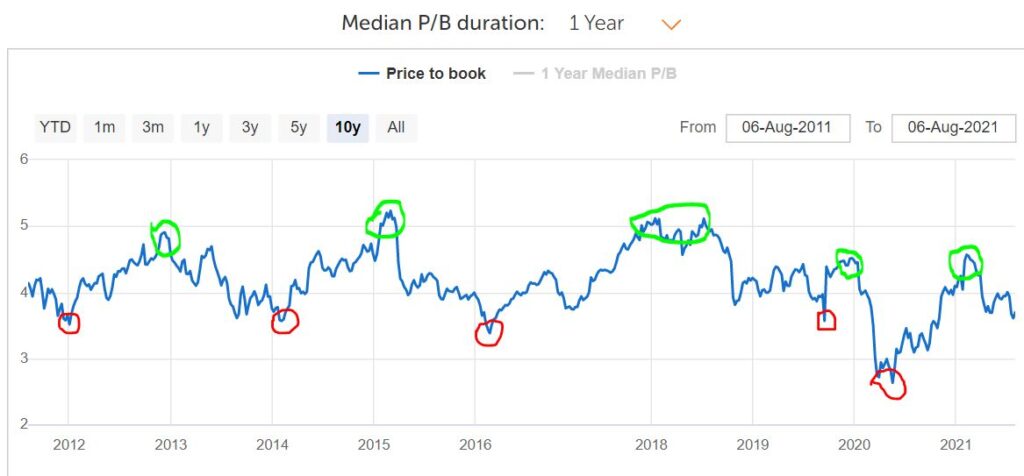
All red marked positions are situations when HDFC bank’s price to book was in significant discount than last 10 year’s median PB.
And green marked positions are highlighting cases, when the PB is way above it’s 10 years’ average.
Now, I would like to see if someone is taking entry in the red marked positions, where he stands after around 1 year from price point. Here is the graph, I took from VRO and marked it with green.
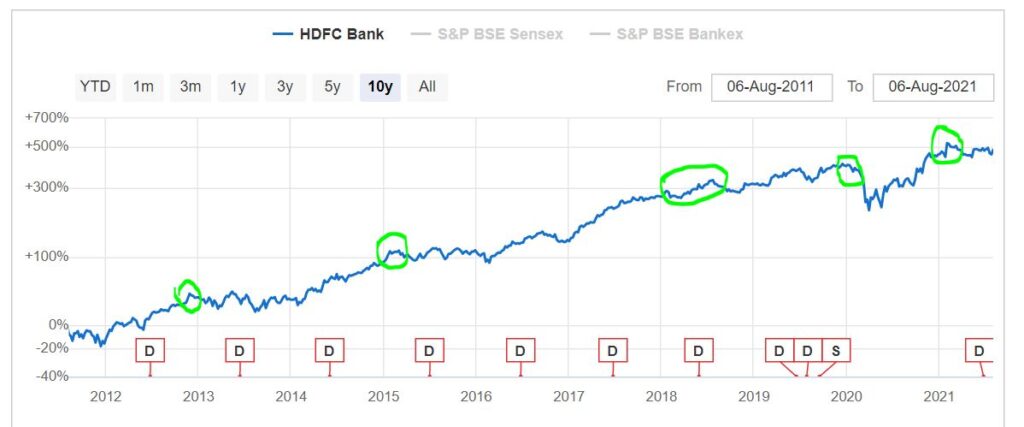
All the green marked cases are price points after approx. 1 year from lower PB value of HDFC Bank.
Any investor who invested in HDFC bank, when it is discounted to its 10-year median PB, is handsomely rewarded in medium to long term.
We need to understand, this simple valuation method is for banks or finance institutions where overall future of that business does not look bleak.
If we execute this mechanism with practice, this can yield wonderful result for matured & stable businesses.
| The valuation analysis looking into median historical PE or PB may not be a good yardstick for a small cap or a microcap company. The above valuation methods are fine for matured & bigger business where there is no fundamental change on the business scenario. |
“Debt” – Very few know how to manage it!
In this section, I am going to talk about debt of a business and how to analyze it from investing standpoint.
I will be focused on two ratios in this section.
#1 Debt to Equity Ratio
#2 Interest coverage Ratio
Debt to Equity Ratio (D/E ratio) –
This ratio gives us an idea of how much debt the company has in its balance sheet compared to the shareholder’s equity (funds from shareholders).
D/E Ratio = Total Liabilities / Shareholders Equity.
This ratio essentially means how much debt is taken compared to the funds coming from operational activities (Own fund).
Many investors consider that D/E ratio beyond 1 is a risky metric and company with higher D/E ratio is riskier to invest on.
Always remember, a company with high debt, need to pay back the debt to bank and that hits its profitability. That means it’s earning will be less at least in foreseeable future.
But again, most of the business work with some debts. So, as retail investors we should not be too obsessed with debt. We just need to find out companies which has either low debts or no debts.
For retail investors, easy to understand concept is most important. Hence it is prudent to avoid companies with high debt to equity ratio.
If you use any screener to filter out companies for further analysis, then you can just put debt to equity ratio below ‘0.5’ and filter out companies which have very low debt comparatively.
But many considers D/E ratio below 1 as safe. For me the lower the D/E, the better it is.
Lower D/E ratio means, whatever the company earns, it does not use a lot of it to pay back debts & interest.
So, whenever you are focusing to filter good companies to invest on always choose a company with low debt to equity ratio. Remember debt to equity ratio of zero means, that company is literally debt free.
Interest Coverage Ratio –
Interest coverage ratio tells us if the company has some debt, then how comfortable the company financially to pay back its debt.
This ratio is very important. Because in practical situation, debt is part of a growing business.
There are very few businesses which is debt free. So, in that sense interest coverage ratio is important because it tells how strong the company is to pay back its loans.
Interest Coverage Ratio = EBIT / Interest Expenses
*EBIT – Earnings before Interest & Taxes.
I hope you understand, higher the interest coverage ratio, better it is for that company. In general terms, if a company has debt with interest coverage ratio below ‘1.5’, then it is considered that the company has limited ability to pay back the debt & it’s riskier investment comparatively.
Example –
To give you a glimpse of how the universe of stocks look like with zero debt, I tried to run a quick scan in all listed companies in India with following metrics. I used both the metrics together –
# Companies with more than 10K crore market cap presently.
# Companies with zero debt to equity ratio
And I found only 40 companies with these metrics. Below is the snapshot of first 20 companies with the above metrics.
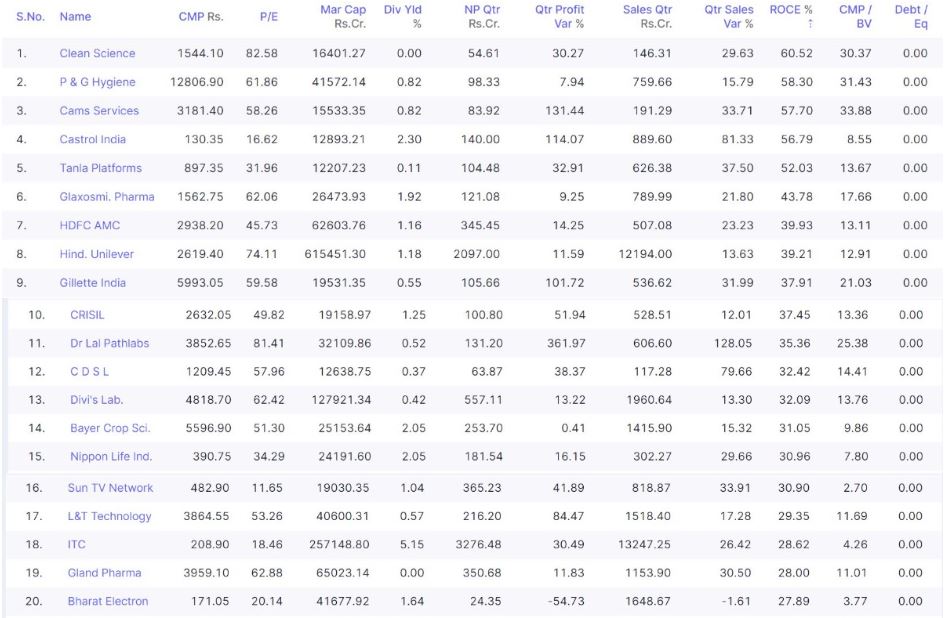
I hope you know many of these companies well. At least you know their names. Look at the list and you can see almost 95% have a ROCE of 15% and above.
Except few many of these companies made good money for their investors.
If you want to run the screener on your own, you can visit screener.in & do it on your own.
Is fundamental analysis enough?
We talked about ROE, valuation metrics, management quality, debt analysis of a listed business. But I do not think all the above is enough to ensure avoid losses from direct equity investments.
There is more than fundamental analysis.
Fundamental analysis is important and give you definite edge over most of the investors.
But if you want to become a better investor, then understanding of technical analysis, risk management, position sizing and little bit of market psychology all becomes handy during investing in direct equity.
Let’s discuss about them in a different thread in future.
I hope you enjoyed the basics of fundamental analysis here. I primarily focused on that part of the fundamental analysis which helps you to put a safety valve on the downside risk of equity investments.
If you are yet to employ the concepts discussed above, then start using them slowly in your equity analysis and I hope you see incremental improvements in your investing journey.
Cheers!